Home:
Diet/Metabolism:
Recipes:
Exercises:
Fitness:
Other:
Story.
Ads: |
  Week
36 Results. Week
36 Results.
I can't believe I've actually stuck to this for 36 weeks. To motivate myself,
I write a web page every 12 weeks, and make new goals. After my first
12 weeks, I published my results, you can
find them by clicking here.
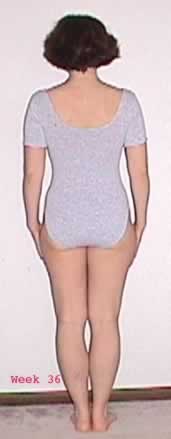
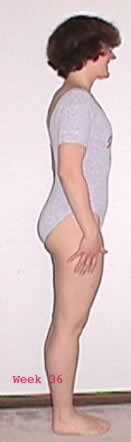
As at the end of week 24, I figured I should show pictures from week
15 and week 36 side by side. (Should have taken a picture in the
leotard on week 1! Silly girl.)
The pictures are shown above and to the right. I didn't lose any
weight between picture 1 and picture 2. According to my fat measuring scale,
I've lost 4 lbs of fat and gained 4 lbs of muscle.
"They" all say you'll be smaller if you have more muscle and less fat.
I keep staring at the pics. Maybe my waist looks more defined? My shoulders
look broader? Oh, I don't know. One thing I know for sure, I had a tan
in July, and I'm really pale right now. I think the tan makes my
lets look leaner!
If you want to track both your weight and your fat mass, you can buy
scales that measure both body fat and weight at HealthTrack and BigFitness
 (Warning: BigFitness has excellent products, but I sometimes have trouble
getting their site to load.)
(Warning: BigFitness has excellent products, but I sometimes have trouble
getting their site to load.)
I've added details describing my weight loss and exercise level below.
Lucia |
Weight Loss Results of Plan 3.
 My
weight loss is plotted to the left. The pink line was the amount
I expected to lose based on the number of calories I burned during
exercise and the number of calories I thought I cut from my diet. I expected
to lose 1 lb every time I burned 3500 calories more than I consumed. At
first, I was eating less than I burned, so you can see the predictive pink
line slopes down.
My
weight loss is plotted to the left. The pink line was the amount
I expected to lose based on the number of calories I burned during
exercise and the number of calories I thought I cut from my diet. I expected
to lose 1 lb every time I burned 3500 calories more than I consumed. At
first, I was eating less than I burned, so you can see the predictive pink
line slopes down.
When I reached my fat loss goal, I started eating as much as I wanted.
So, I didn't expect to lose anymore weight. If you examine the plot,
you'll see that I continued to lose weight. My weight dipped to 124 lbs
or so around week 26 of my plan. Didn't actually intend that... Fortunately,
I eventually stopped losing weight, and started regaining.
I was lifting weights 3 times a week, and I hoped that I would gain
muscle. If you look carefully, you'll see that my weight eventually
plateaued around 125 lbs. My fat level is holding fairly constant. I kept
16 lbs of fat off. What does that mean? I think I gained muscle. Yay!!!
 You
can see the muscle gain more clearly in the graph to the right. My
lean muscle mass seems to be near 100 lbs now. I sort of calculated
a minimum muscle for myself using the information at my
BMI page. I wrote up the healthy weight and body fat percentages there.
I think I should try to gain 4 more lbs of muscle. But it's been
pretty difficult to do.
You
can see the muscle gain more clearly in the graph to the right. My
lean muscle mass seems to be near 100 lbs now. I sort of calculated
a minimum muscle for myself using the information at my
BMI page. I wrote up the healthy weight and body fat percentages there.
I think I should try to gain 4 more lbs of muscle. But it's been
pretty difficult to do.
Still, there is hope. I am lifting progressively heavier weights.
I'm getting a lot stronger. I'm trying to track how strong I am using
a few important bench marks. I can now:
-
Do 15 normal pushups fairly easily.
-
Do 2 pull ups (but zero chin ups.)
-
Do 15 lat pull downs at 75 lbs.
-
Bench press 70 lbs, 15 times.
-
Leg press 220 lbs, 15 times.
I'm concentrating on being able to do 15 pullups and 15 chin ups by the
end of week 4.
By the way, I tracked my progress and created this plot using an EXCEL
spread sheet. People who aren't as, ahem, thrifty, as I am may want
to consider special purpose software. You can find software at HealthTrack.
Exercise:
 My
diet and exercise plan had real aerobic exercise goals. These included
aerobics, aka cardio, exercise and weight lifting.
My
diet and exercise plan had real aerobic exercise goals. These included
aerobics, aka cardio, exercise and weight lifting.
During my first program, the aerobics were done on my Nordic track ski
machine. Later on, I discovered the Lisle Park District exercise facility.
I now alternate using the ski machine, an elliptic machine and a treadmill.
All three machines estimate the number of calories I burned doing vigorous
aerobic activity each day. I entered those into my spread sheet and made
a plot. The plot to the right shows how much I planned to exercise
and how much I actually exercised. The pink line shows the number
of calories I planned to burn. The pink x's show the number of calories
I think I burned.
Between weeks 24-36, I made my cardio goal all but two weeks. What happened
those two week? Well, I worked the polls one week, and blew my schedule
on the Tuesday and the Wednesday. Then.... can you say Thanksgiving?
Yeah. I stayed home on Thursday- Sunday that week. We'll see how
Christmas goes! Whey.
I also planned to lift weights 2 or 3 times a week. I managed
to do lift weights 3 times every week except weeks 32 and 35. (Yes, I blew
it the same weeks I blew my cardio.). I didn't know exactly how to plot
that, so you don't get a plot!
By the way, I like to set achievable goals. I knew my schedule
and level of fitness would allow me to meet this goal-- as long as I actually
did
it. I find setting a goal I can meet-- provided I just do it, is
more motivating than creating a very ambitious goal that requires me to
increase my level of fitness, or carve out precious time I don't have.
More Pics:
  More
Pictures! More
Pictures!
Here are two more sets of week 15 and week 36 photos. I'm still
happy with how I look. I have to say though, ... even if I did gain
4 lbs muscle and lose 4 lbs fat, I don't think I look thinner! I think
my shouders look wider in the week 36 photos.
I guess I'll take more pics 12 more weeks and see how I look.
What do I plan to do next?
Well, I need to develop my "Fourth 12 Week Plan". Once again, I'd like
to put on 2 lbs of muscle in 12 weeks and maintain my over all weight.
I think 129 lbs is perfectly healthy, I've noted that as the target weight
loss on my weight loss chart. I won't go back to cutting 500 calories a
week unless my weight reaches 130 lbs.
Lucia
|
  |
Created: July 1, 2002. Revised: July 25
© 2002 , All rights reserved.