| Home:
Diet/Metabolism:
Recipes:
Exercises:
Fitness:
Other:
Story.
Ads: |
  2nd Diet and Exercise Plan: Results.
My first 12 week plan to lose weight consisted of cutting out roughly 3
candy bars a week, otherwise eating as I did before dieting, doing aerobics
and strength training. I published the
results, and promised myself to write once every 12 weeks. I figure
this will motivate me to keep up the good work.
I've finished the second two weeks. This page shows you how things went.
Granted, I'm on weight "maintenance" now. I'm not trying to lose
weight anymore. I just want to stay the same weight, but I would like to
build muscle.
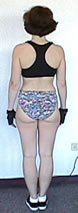
I figured I should show pictures from week 15 and week 24 side by side.
You'll recall I didn't take one right at the end of week 12.
The pictures are shown above and to the right. I didn't lose much
weight between picture 1 and picture 2. I doubt you can tell which
picture is first, and which is second. Anyway, I'm wearing the gray leotard
in the picture I took after week 15; I'm wearing print trunks and exercise
top in the picture I took Sept. 18, 2002 (after week 24 or my plan).
I'd lost about 2 or 3 pounds during that time. I'd planned to stay at the
same weight, lose fat and gain muscle. Well, I lost some fat, but I didn't
manage to gain any muscle.
If you want to track both your weight and your fat mass, you can buy
scales that measure both body fat and weight at HealthTrack and BigFitness
 (Warning: BigFitness has excellent products, but I sometimes have trouble
getting their site to load.)
(Warning: BigFitness has excellent products, but I sometimes have trouble
getting their site to load.)
I've added details describing my weight loss and exercise level below.
Lucia |
Weight Loss Results of Plan 2.
 My
weight loss is plotted to the left. The pink line was the amount
I expected to lose based on the number of calories I burned during exercise
and the number of calories I cut from my diet. I expected to lose 1 lb
every time I burned 3500 calories more than I consumed. At first, I was
eating less than I burned, so you can see the line slopes down.
My
weight loss is plotted to the left. The pink line was the amount
I expected to lose based on the number of calories I burned during exercise
and the number of calories I cut from my diet. I expected to lose 1 lb
every time I burned 3500 calories more than I consumed. At first, I was
eating less than I burned, so you can see the line slopes down.
The light blue squares indicate my total weight loss; the dark blue
circles indicate my fat loss. As you can see, I lost more weight than predicted.
I suspect the reason for this was that I ate less than I thought I was
eating. My diet was supposed to be "stop buying 3 candy bars a week and
keep eating the same". I pretty much assumed I ate however much I
ate minus the candy bar calories. In fact, I know I ended up planning meals
and watching what I ate more carefully. (Although, who knows? Maybe I was
really eating 5 candy bars a week. What a horrifying thought!)
At week 14, I had met my weight loss goal. At that point, I began to
let myself eat more; that's why the pink curve becomes a straight horizontal
line after week 14. Since I'd been losing a little under 1 lb a week,
I was planning to add 400 to 500 calories a day to my diet, but
I planned to keep exercising. I'm pretty sloppy about counting calories,
so I just planned meals using my food
pyramid tool. I eyeball my food portions, but I try to be honest.
I think I'm eating about 2000 calories a day now.
Even though my plan is to maintain weight, I seem to be losing weight
slowly. I seem to have lost 2 lbs since I switched to maintenance.
I'll admit I've been concerned that the transition to maintenance is a
dangerous time. I've been monitoring my food, and I got a little
worried when my weight spiked slightly between week 18 and week 20.
Admittedly, I shouldn't have worried, because I was still below
my target weight-- but I was worried. I think I'm getting used to
the level of food I should be eating now. So, I should be able to maintain
weight during my next 12 week plan.
By the way, I tracked my progress and created this plot using an EXCEL
spread sheet. People who aren't as, ahem, thrifty, as I am may want
to consider special purpose software. You can find software at HealthTrack.
Exercise:
 My
diet and exercise plan had real aerobic exercise goals. These included
aerobics, aka cardio exercise and weight lifting.
My
diet and exercise plan had real aerobic exercise goals. These included
aerobics, aka cardio exercise and weight lifting.
During my first program, the aerobics were done on my Nordic track ski
machine. Later on, I discovered the Lisle Park District exercise facility.
I now alternate using the ski machine, an elliptic machine and a treadmill.
All three machines estimate the number of calories I burned doing vigorous
aerobic activity each day. I entered those into my spread sheet and made
a plot. The plot to the right shows how much I planned to exercise
and how much I actually exercised. The pink line shows the number
of calories I planned to burn. The pink x's show the number of calories
I think I burned.
You can see I met my goal every week except week 24. What happened that
week? Well, my husband and I take a long weekend camping in Wisconsin every
fall. I missed some aerobic workouts. I could have estimated
the calories I used on walks about the lake, but I didn't! So, it looks
like I fell just short of the mark. That's ok though.
I also planned to lift weights 2 or 3 times a week. I managed
to do lift weights 3 times every week except week 24. I when I lifted 2
times. I didn't know exactly how to plot that, so you don't get a
plot!
By the way, I like to set achievable goals. I knew my schedule
and level of fitness would allow me to meet this goal-- as long as I actually
did
it. I find setting a goal I can meet-- provided I just do it, is
more motivating than creating a very ambitious goal that requires me to
increase my level of fitness, or carve out precious time I don't have.
Weekly Plot:
 I
want to show y'all something. Remember the weight loss plot above?
Progress looked smooth and steady, right? Look at the plot to the
left. I estimated how much weight I should lose each week based
on diet and exercise. That estimate is shown with blue diamonds and called
"credit". I also weighed myself every day, and then determined my
average weight for the week. I then calculated how much my weight
changed during that week. That's shown in orange.
I
want to show y'all something. Remember the weight loss plot above?
Progress looked smooth and steady, right? Look at the plot to the
left. I estimated how much weight I should lose each week based
on diet and exercise. That estimate is shown with blue diamonds and called
"credit". I also weighed myself every day, and then determined my
average weight for the week. I then calculated how much my weight
changed during that week. That's shown in orange.
The weight loss looks pretty irregular, right? Some weeks, it
looked like I gained weight. Depressing!
In reality, I hadn't gained weight. You'll weight gains are always
followed by large weight losses. For that matter, small weight gains
are followed by larger weight losses. That's because the gains were
water. I lost weight fairly steadily; it just doesn't look to that if you
focus on weekly weight losses.
Based on this, my opinion is that it's best to focus on your diet and
exercise goals, and track those. (As I did using the pink line in the plot
above, and the "credit" points shown in blue here.) Make a plot of
your cumulative weight loss, not your weekly weight loss. Then, don't
expect the cumulative weight loss curve to reflect "reality" for at least
3 weeks. My technique of weighing everyday and plotting the weekly average
also smoothes out the graph. You should do that if you can bring
yourself to accept that the daily weights aren't "real". Convince
yourself that only the weekly average weights are remotely "real".
(You should convince yourself of this because it's true.)
  More
Pictures! More
Pictures!
Here are two more "after" photos. I took a picture of myself
wearing print trunks and a black top on Sept. 19, 2002 near the middle
of week 25! I weigh about 123 or 124 lbs. Evidently, my body fat
is 21.%. I measured both using my scale. (The gray leotard is 10
weeks earlier. )
Britney Spears still looks better! But I'm happy with how I look.
After all, I am 43 years old, and I'm not an entertainer. I don't need
to be wafer thin! (Based on studies on mortality, my weight is actually
very near the optimum for an adult woman of my height.)
I'm not sure if you can tell, but I think my abdomen is flatter.
My waist is a little thinner. My hips are about the same. I've measured;
my hip measurement hasn't changed. I think the tan in the first picture
actually makes my butt look better! (Plus, the leg elastic in the trunks
is tighter-- so that's smooshing my butt a little.)
We'll make more comparisons in 12 more weeks!
What do I plan to do next?
Well, I need to develop my "Third 12 Week Plan". At 126 lbs, I'm
5 or 6 lbs below my target weight! I'd like to put on 2 lbs of muscle.
Still, let's face it, despite weight lifting at the gym 3 times a week,
all I've managed to do is strengthen, firm and retain muscle. (People usually
lose 1 lb muscle for every 10 lbs lost. So, I guess not losing 1 lb of
muscle while losing weight is sort of like gaining a lb under non-diet
conditions???)
Anyway, we'll see if I can gain 1 lb of muscle during the next 12 weeks.
I've read that a goal of 1 lb every 2 months is reasonable. So, I'll
make a 1 lb muscle gain my target.
I plan to maintain my weight because I'm like this weight. But since
I think 129 lbs is perfectly healthy, I won't go back to cutting 500 calories
a week unless my weight reaches 130 lbs.
|
  |
Lucia
Created: July 1, 2002. Revised: July 25
© 2002 , All rights reserved.